Faster record identification
A design goal was to make locating the relevant record more direct through scanner-assisted input.
SELECTED PROJECT · ANIMAL HEALTH
A tailored web application can help teams capture animal observations, organise historical information, and review changes through structured reports and visualisations.
Abstract illustration of a recorded trend
Project context
Paper notes and disconnected records can make it difficult to follow observations over time. This project explored how scanner-assisted identification, structured input, historical records, and simple visual reporting could be brought together in one web application.
A design goal was to make locating the relevant record more direct through scanner-assisted input.
Keep dated observations together in a consistent record for later review.
Present recorded information through reports and graphs, without interpreting it as a diagnosis.
Project workflow
Use scanner-assisted input or search to locate the relevant animal record.
Enter the available measurements or notes in a structured form.
Keep dated observations together for later review.
Present previous records and visual trends in a clearer format.
PROJECT INTERFACE
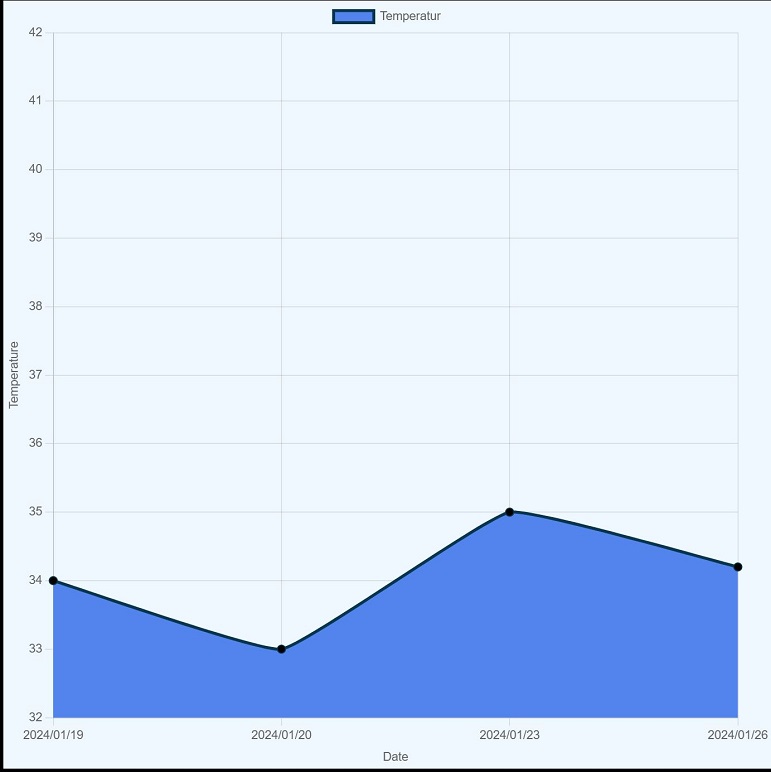
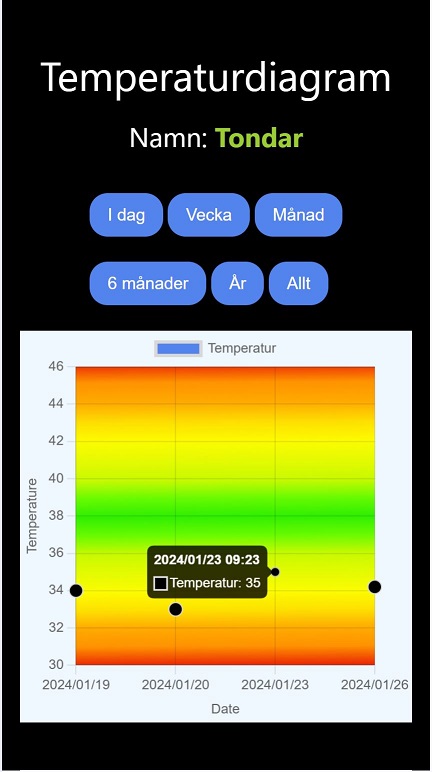
Interface examples are shown for demonstration purposes. Data fields, workflow, and visualisation are adapted to the requirements of each implementation.
Project scope
Responsible scope
This project example concerns data recording and visualisation. It is not presented as a diagnostic tool or a substitute for professional veterinary assessment.
The final scope of a similar application would depend on the users, data requirements, privacy needs, operating environment, and any applicable professional or regulatory requirements.
TAILORED WEB APPLICATIONS
Show us how observations are collected and reviewed today. We can discuss a focused digital workflow for recording, history, and reporting.